- Geometrical Informations
- Surface
- The number of pixels in the region.
- Perimeter
- The number of pixels on the outline of the region.
- Mean
- The mean of the coordinates of the points within the region.
- Points of Including Rectangle (min & max)
- The coordinates of the minimal point (at the left top) and the maximal point (at the right bottom) of the including rectangle of the region.
- Height of Including Rectangle
- The height (in number of pixels) of the including rectangle of the region.
- Width of Including Rectangle
- The width (in number of pixels) of the including rectangle of the region.
- Center of Including Rectangle
- The coordinates of the center of the including rectangle of the region.
- Ratio Surface/(Height*Width)
- Ratio between the area of the region and the one of it including rectangle. This measure is 1.0 for a perfect rectangle and approaches zero for very small structures.
- Ratio Perimeter/(2*Height*Width)
- Ratio between the perimeter of the region and this of it including rectangle. This measure is 1.0 for a convex region, larger for regions with boundaries which double back on themselves.
- Ratio (16*Surface)/(Perimeter**2)
- This measure is 1.0 for a perfect square, smaller for shapes with irregular boundaries and maximal for a perfect circle in continuous.
- Log10(Height/Width)
- This value gives a symmetric measure of the aspect ratio.
- Direction of the Major Axis
- The direction of the major axis of the set of (x,y) points belonging to the region.
- Angle of the Major Axis (radian)
- The angle (in radians) of the major axis of the region.
- Angle of the Major Axis (degree)
- The angle (in degrees) of the major axis of the region.
- Elongation (Length/Width)
- Ratio between the length and the width of the including rectangle of the region. This measure approaches 1 for a perfect circle (or square) and tends to 0 or the infinite for elongated shapes.
- Elongation (with the eigen values)
- Ratio between the eigen value of the major axis and the sum of the eigen values. This measure approaches 1.0 for an elongated shape and .5 for a square or a circle.
- Photometrical informations
- Mean Color
- The mean red, green and blue values of the pixels within the region.
- Red Variance
- The value of the red colorimetric variance.
- Green Variance
- The value of the green colorimetric variance.
- Blue Variance
- The value of the blue colorimetric variance.
- Squared Error
- The value of the squared error of the region.
- ExColor
- The exred, exblue, exgreen values. The excolor value is the deviation between (2*mean color) and the sum of the mean values of the two others colors. A good indication of whether the region appears color.
- Dominant Color
- This measure give the dominant color in the region.
- Intensity
- (Mean Red+Mean Green+Mean Blue)/3. This measure represent the mean intensity of the region.
- Hue
- The value of the Hue of the region in the HSV space.
- Saturation
- The value of the Saturation of the region in the HSV space.
- First Color Vector
- The direction of the first eigen vector in the RGB space.
- Second Color Vector
- The direction of the second eigen vector in the RGB space.
- Third Color Vector
- The direction of the third eigen vector in the RGB space.
- Principal Axis Infos
- Ratio between v1 and v1+v2+v3 where v1 ,v2 and v3 corresponding to the eigen values of the three eigen vectors in the RGB space.
- Principal Plane Infos
- Ratio between v1+v2 and v1+v2+v3 where v1, v2 and v3 corresponding to the eigen values of the three eigen vectors in the RGB space.
- Topological informations
- Number of neighbors
- The number of regions which share a boundary with the selected region.
- Adjacent to an infinite face
- "yes" if the region is adjacent to an infinite face (adjacent to the external boundary of a connected component)
- Number of included connected components
- The number of included connected components included in the selected region. An included connected component is made by one or more adjacent regions which are included in the selected region. This group of included regions form a connected component globally included in the selected region.
- Number of holes
- The number of regions which are included into the selected region. We sum for each included connected component the number of regions which composed it.
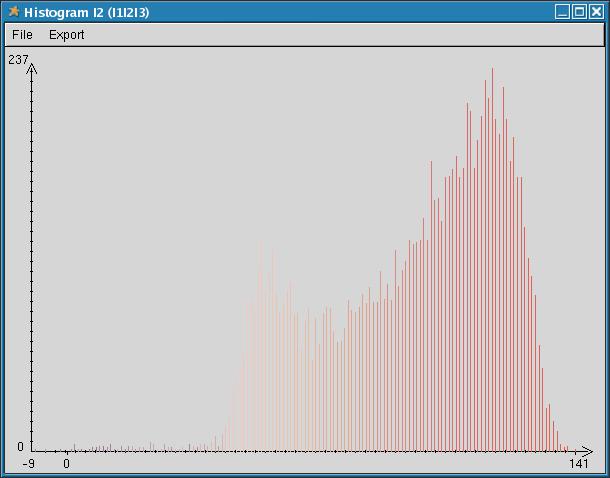
- Histograms of one dimension Each bin of this histograms represents the number of pixels within the selected region whose selected component is equal to the height of the bin.
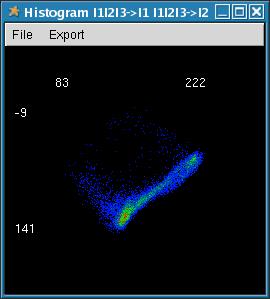
- Histograms of two dimensions This histograms represent the cross histogram of two components. Each pixel of the resulting image represents the number of pixels within the selected region which have the same value of the two corresponding components. The width of the histogram refers to the first component and the height refers to the second component. The number of points is showed with a color scale :
- black
- means that no pixels within the region correspond to the speicied coordinates
- blue
- corresponds to the minimal (non null) value of the histogram
- green
- corresponds to the median value
- red
- correponds to the maximal value
For example, the histogram of the component R shows the number of pixels which have a same value of R in the space RGB with R varying from the minimal to the maximal value in R that may be found within the region.


